Ookla, 2016—2020
Speedtest: making it convenient for 100m+ people
+200%
Global usage since 2016
18m+
User-initiated tests daily
150M+
Installations
4.6
App Store rating


Products
Desktop apps
Mobile & Tablet apps
Apple TV app
Browser extension
Website
Team
Project Manager
Senior Designer
UX/UI Director (me)
What I Did
Design audit
UX/UI & User research
Key UX/UI design
UX/UI direction
User testing
Speedtest.net is an internet service that allows users to test the speed and performance of their internet connection in terms of download and upload speed, as well as latency. It is used by individuals, businesses, and internet service providers to diagnose and troubleshoot internet connectivity issues. Speedtest is used by millions of people daily. Its advanced technology made it stand out among dozens of competitors and become the most trusted internet speed test in the world.
Testing whether a 4k video will stream on your Apple TV, checking if you can make a two-hour work call at a cafe, or verifying the honesty of your home network provider’s offer — Speedtest is the #1 tool to use.


As a hired Clay agency member, together with a PM and a Creative Director, I engaged in consultations with the Speedtest team to gain a deep understanding of the project goals. Additionally, I communicated with developers to understand their capabilities and technical constraints.
Ookla's objectives for the product
Renew the visual style of all products to align with the company’s innovative goals and principles.
Revise the usability of all products in accordance with studies-backed best practices in UX design.
Facilitate quick testing of various hypotheses and sub-products under the Speedtest brand by developing a scalable and agile design system.
Following the release of iOS7, there was a global shift towards a flatter UI design language that no longer relied on real-world object resemblance to achieve user-friendliness. By 2015, the skeuomorphic design of Speedtest had started to look outdated in comparison to the new design environment. Our challenge was to develop a new visual language that would work seamlessly across both mobile and web platforms.
I conducted a thorough analysis of both direct and indirect Speedtest competitors' software to assess their feature sets, information architecture, UX/UI practices, and visual style. We got valuable insights on the best practices to adopt and areas to avoid.

Our first step was to map out the existing structure of the Speedtest version by creating a spider-looking diagram, including all entities and actions. Upon analysing the scheme, we identified structural inconsistencies and proposed improvements to the hierarchy.
In 2016, we prioritised the features and defined primary and secondary ones, proposing a new app structure with the homescreen entirely dedicated to the internet speed test and network exploration, while grouping utility pages like settings or test results under a profile icon.
As the initial task involved only slight feature set changes and non-dramatic structural changes, we did not include the wireframing stage in the project scope. Instead, we began working on creating the visual style while simultaneously implementing the new structure.


After creating a visual style in 2016, we assisted Ookla in designing new product features. Our design system made it easy to create and release designs to production without wireframing. We worked with Ookla’s analytics as they tested and released these features, using them to refine and enhance performance. Although not all features are still in use today, we gained many valuable insights.

Over the years, the global navigation underwent continuous revision and A/B testing. It eventually led to the return of the tab bar with core sections, which changed over time, introducing new features such as the VPN.
Here are some design approaches that served as the foundation for the whole system redesign.
1. Optimising the gauge
At the beginning, there was a discussion about whether to keep the gauge as the primary visual in the design. While gauges are recognizable symbols of speed, the old Speedtest’s gauge was not helpful in simplifying the perception of data. The gauge’s bright visuals drew attention away from the information, so its look and behavior were significantly simplified to support result perception and avoid distracting users from the test results.
2. Meaningful colour scheme
We suggested to color only the part of the gauge that reflected the current speed and fade out the higher speed ranges. This approach allowed casual users to quickly understand whether their internet speed was satisfactory, without requiring precise measurements.
Overall, testing that had been conducted by the client, revealed a 50-70% increase in the speed of information perception.

Before

After
3. Animations, facilitating comprehension


4. Non-intrusive & effective ads
Speedtest earns by displaying partner’s ads and there are a lot of them within the Speedtest products. The challenge was to find the best places for ads to be prominent, but not intrusive.
While competitors disturbed (and still do) their users with sudden full-screen animated ads with hardly distinguishable Close icons, we conducted a usability test, during which the respondents were told that they were testing the internet speed test usability, but in reality, they were testing ad performance (we did not tell them to avoid bias).
The ad copy said that after the test they are eligible for a reward, but only if they noticed the ad and told the team. The best performing ads (+30–50% performance) were those at the end of the test, which later has been confirmed on production.


Speedtest is a versatile tool used by millions of people in a variety of contexts, such as testing whether a 4k video will stream on their Apple TV, checking if they can make a two-hour work call at a cafe, or verifying the honesty of their home network provider’s offer.
Additionally, Speedtest Enterprise is used by brands as an embedded module. Our task was to design a user interface that would be flexible enough to accommodate all platforms and use cases while maintaining the usability and enhancements that we had implemented.
Together with a UX/UI Designer we developed a comprehensive design system that included all design assets, such as colours, typography, icons, animation guidelines, responsiveness guidelines, interactive elements behaviour, and feedback principles.

Speedtest Enterprise Customizable Widget

Apple TV App
After the redesign was completed, Speedtest utilised the design system, guidelines, and principles we created to internally evolve the Speedtest family.
Our prominent and memorable visual style has had a significant impact on the look and feel of competitor apps.
+200%
Global usage since 2016
18m+
User-initiated tests daily
150M+
Installations
4.6
App Store rating
Julia’s work determined the visual design and user experience of the Speedtest family of products. Over five years, she and her team were responsible for designing the UX/UI of all products, creating a scalable, adaptive, consistent, and intuitive user interface.
Mike Kane, VP Experience at Ookla
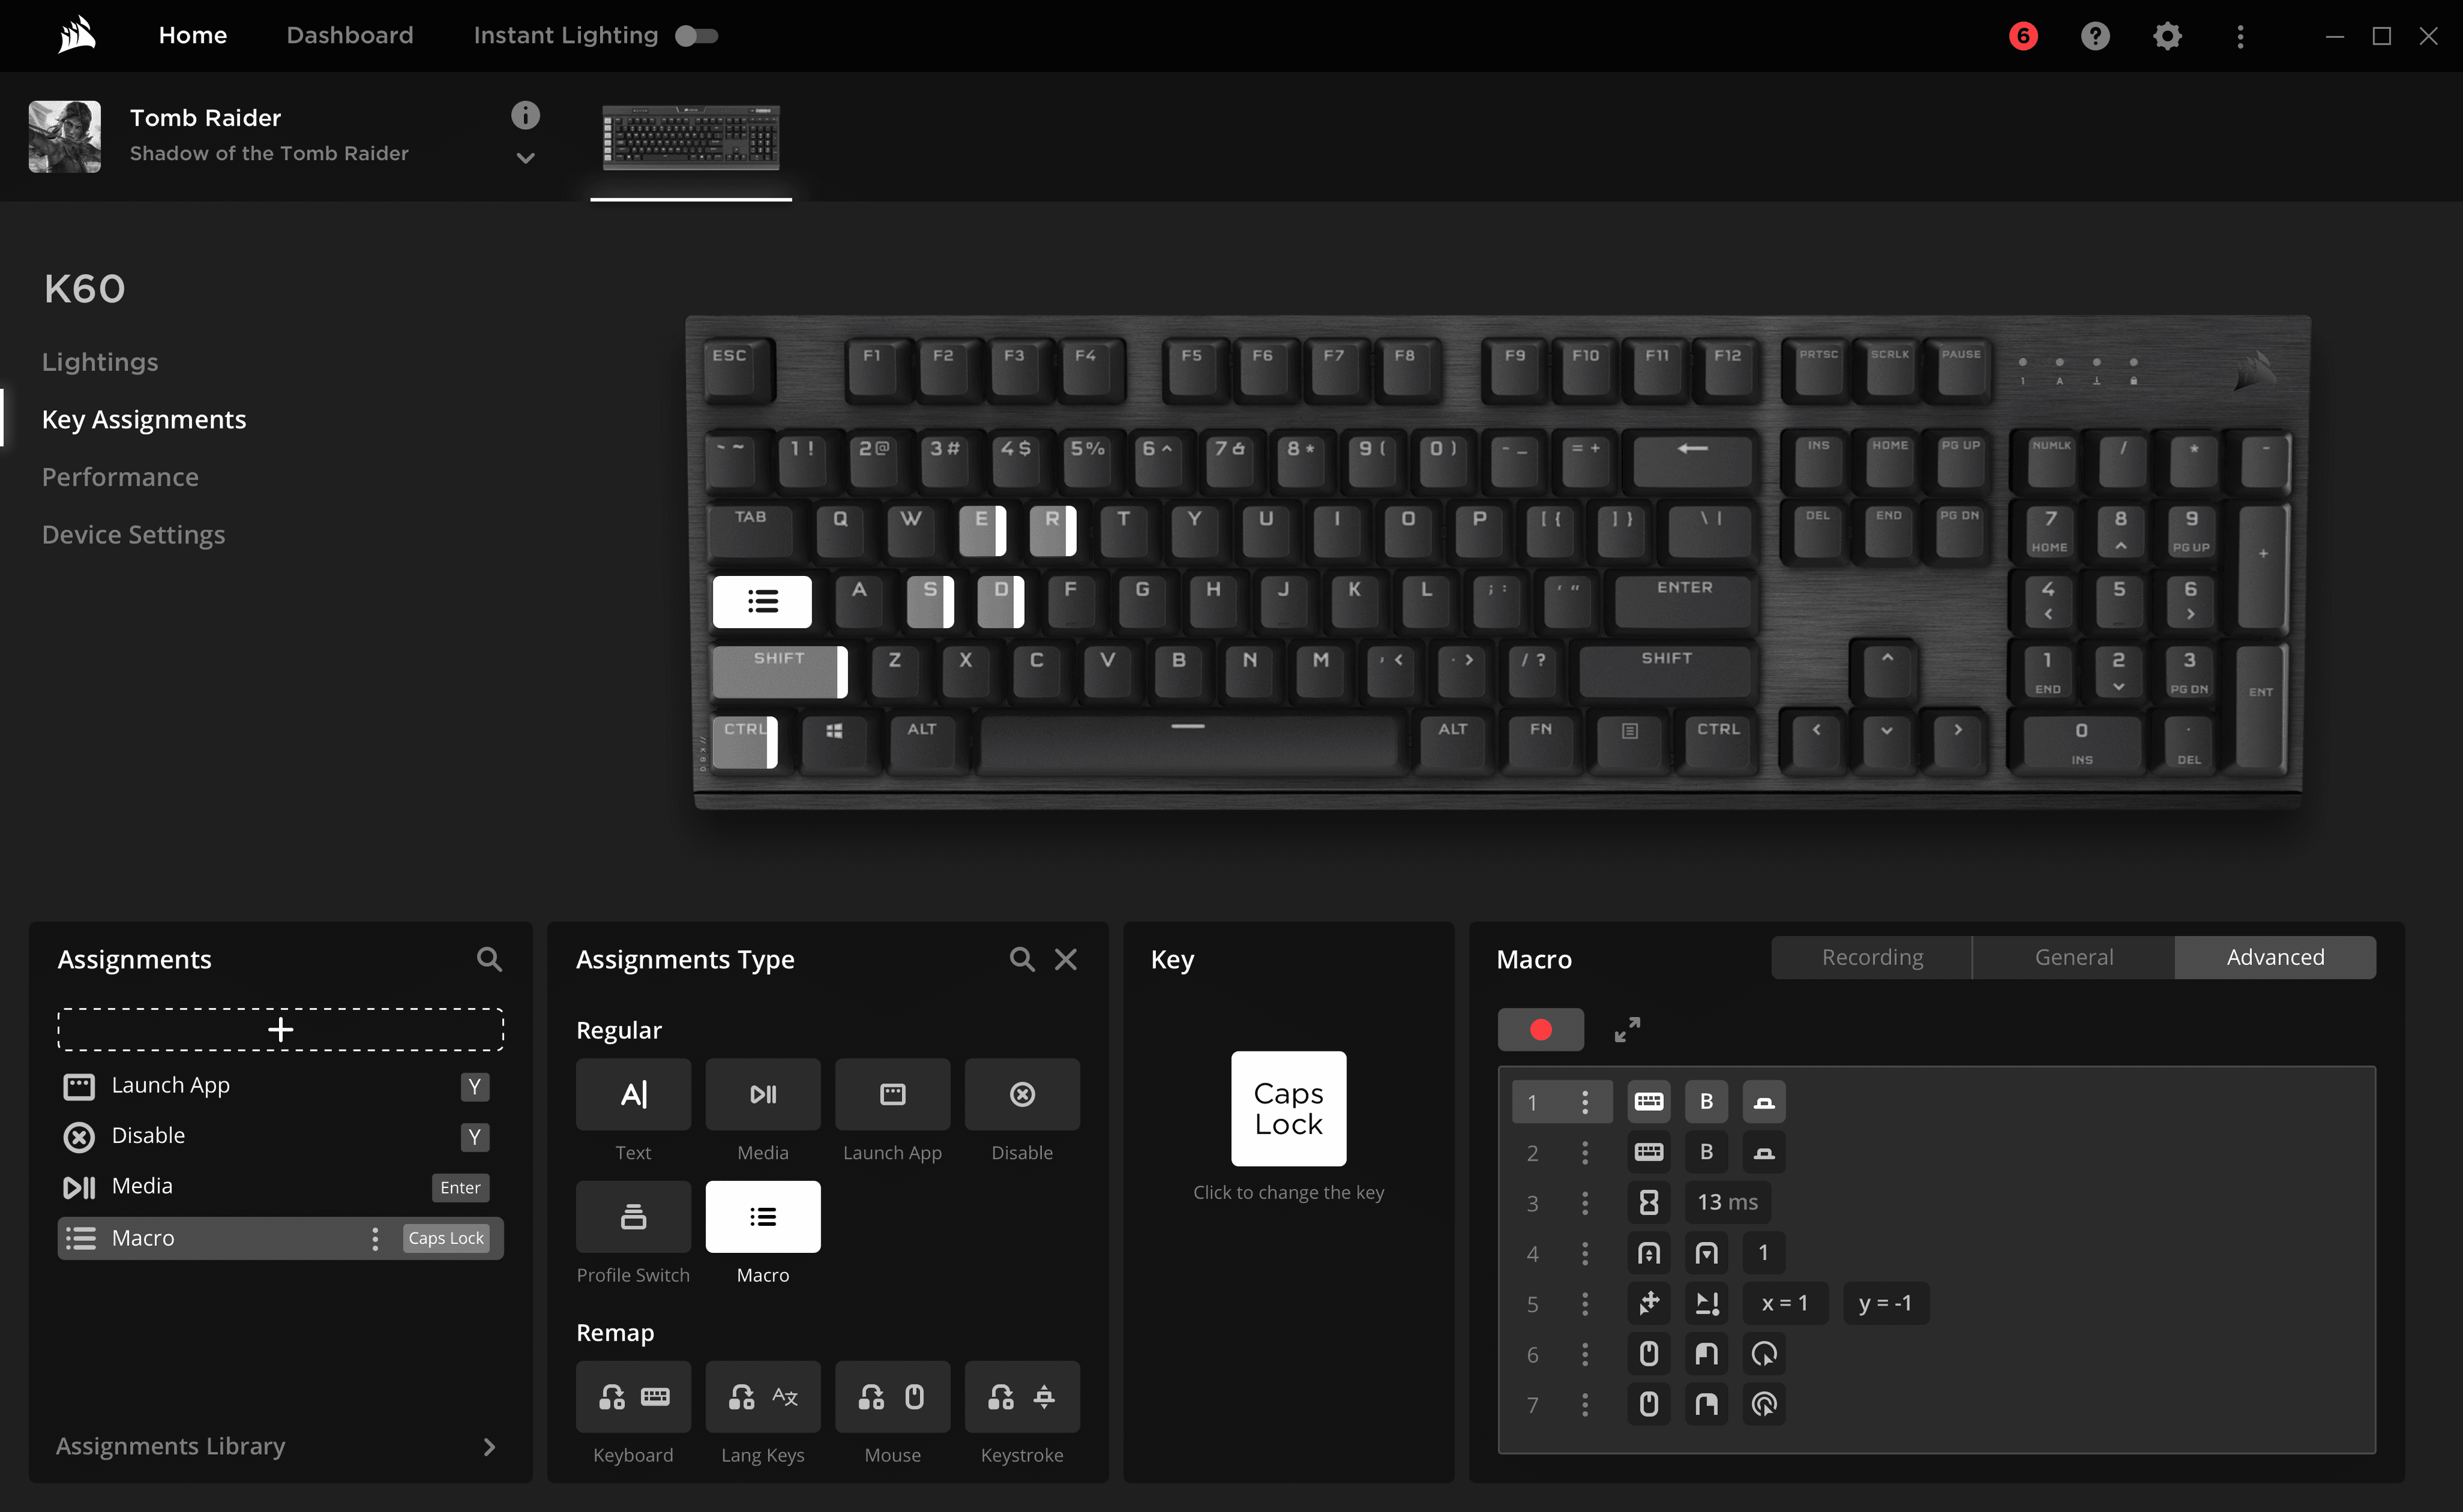
Corsair iCUE: gaming gear control hub redesign


Google Jacquard: app for interactive garments